Securities Lending Dashboard

Securities Lending Dashboard
Use daily short sale data on thousands of securities worldwide to generate trade ideas, gauge short sentiment and evaluate your portfolio from a different angle.
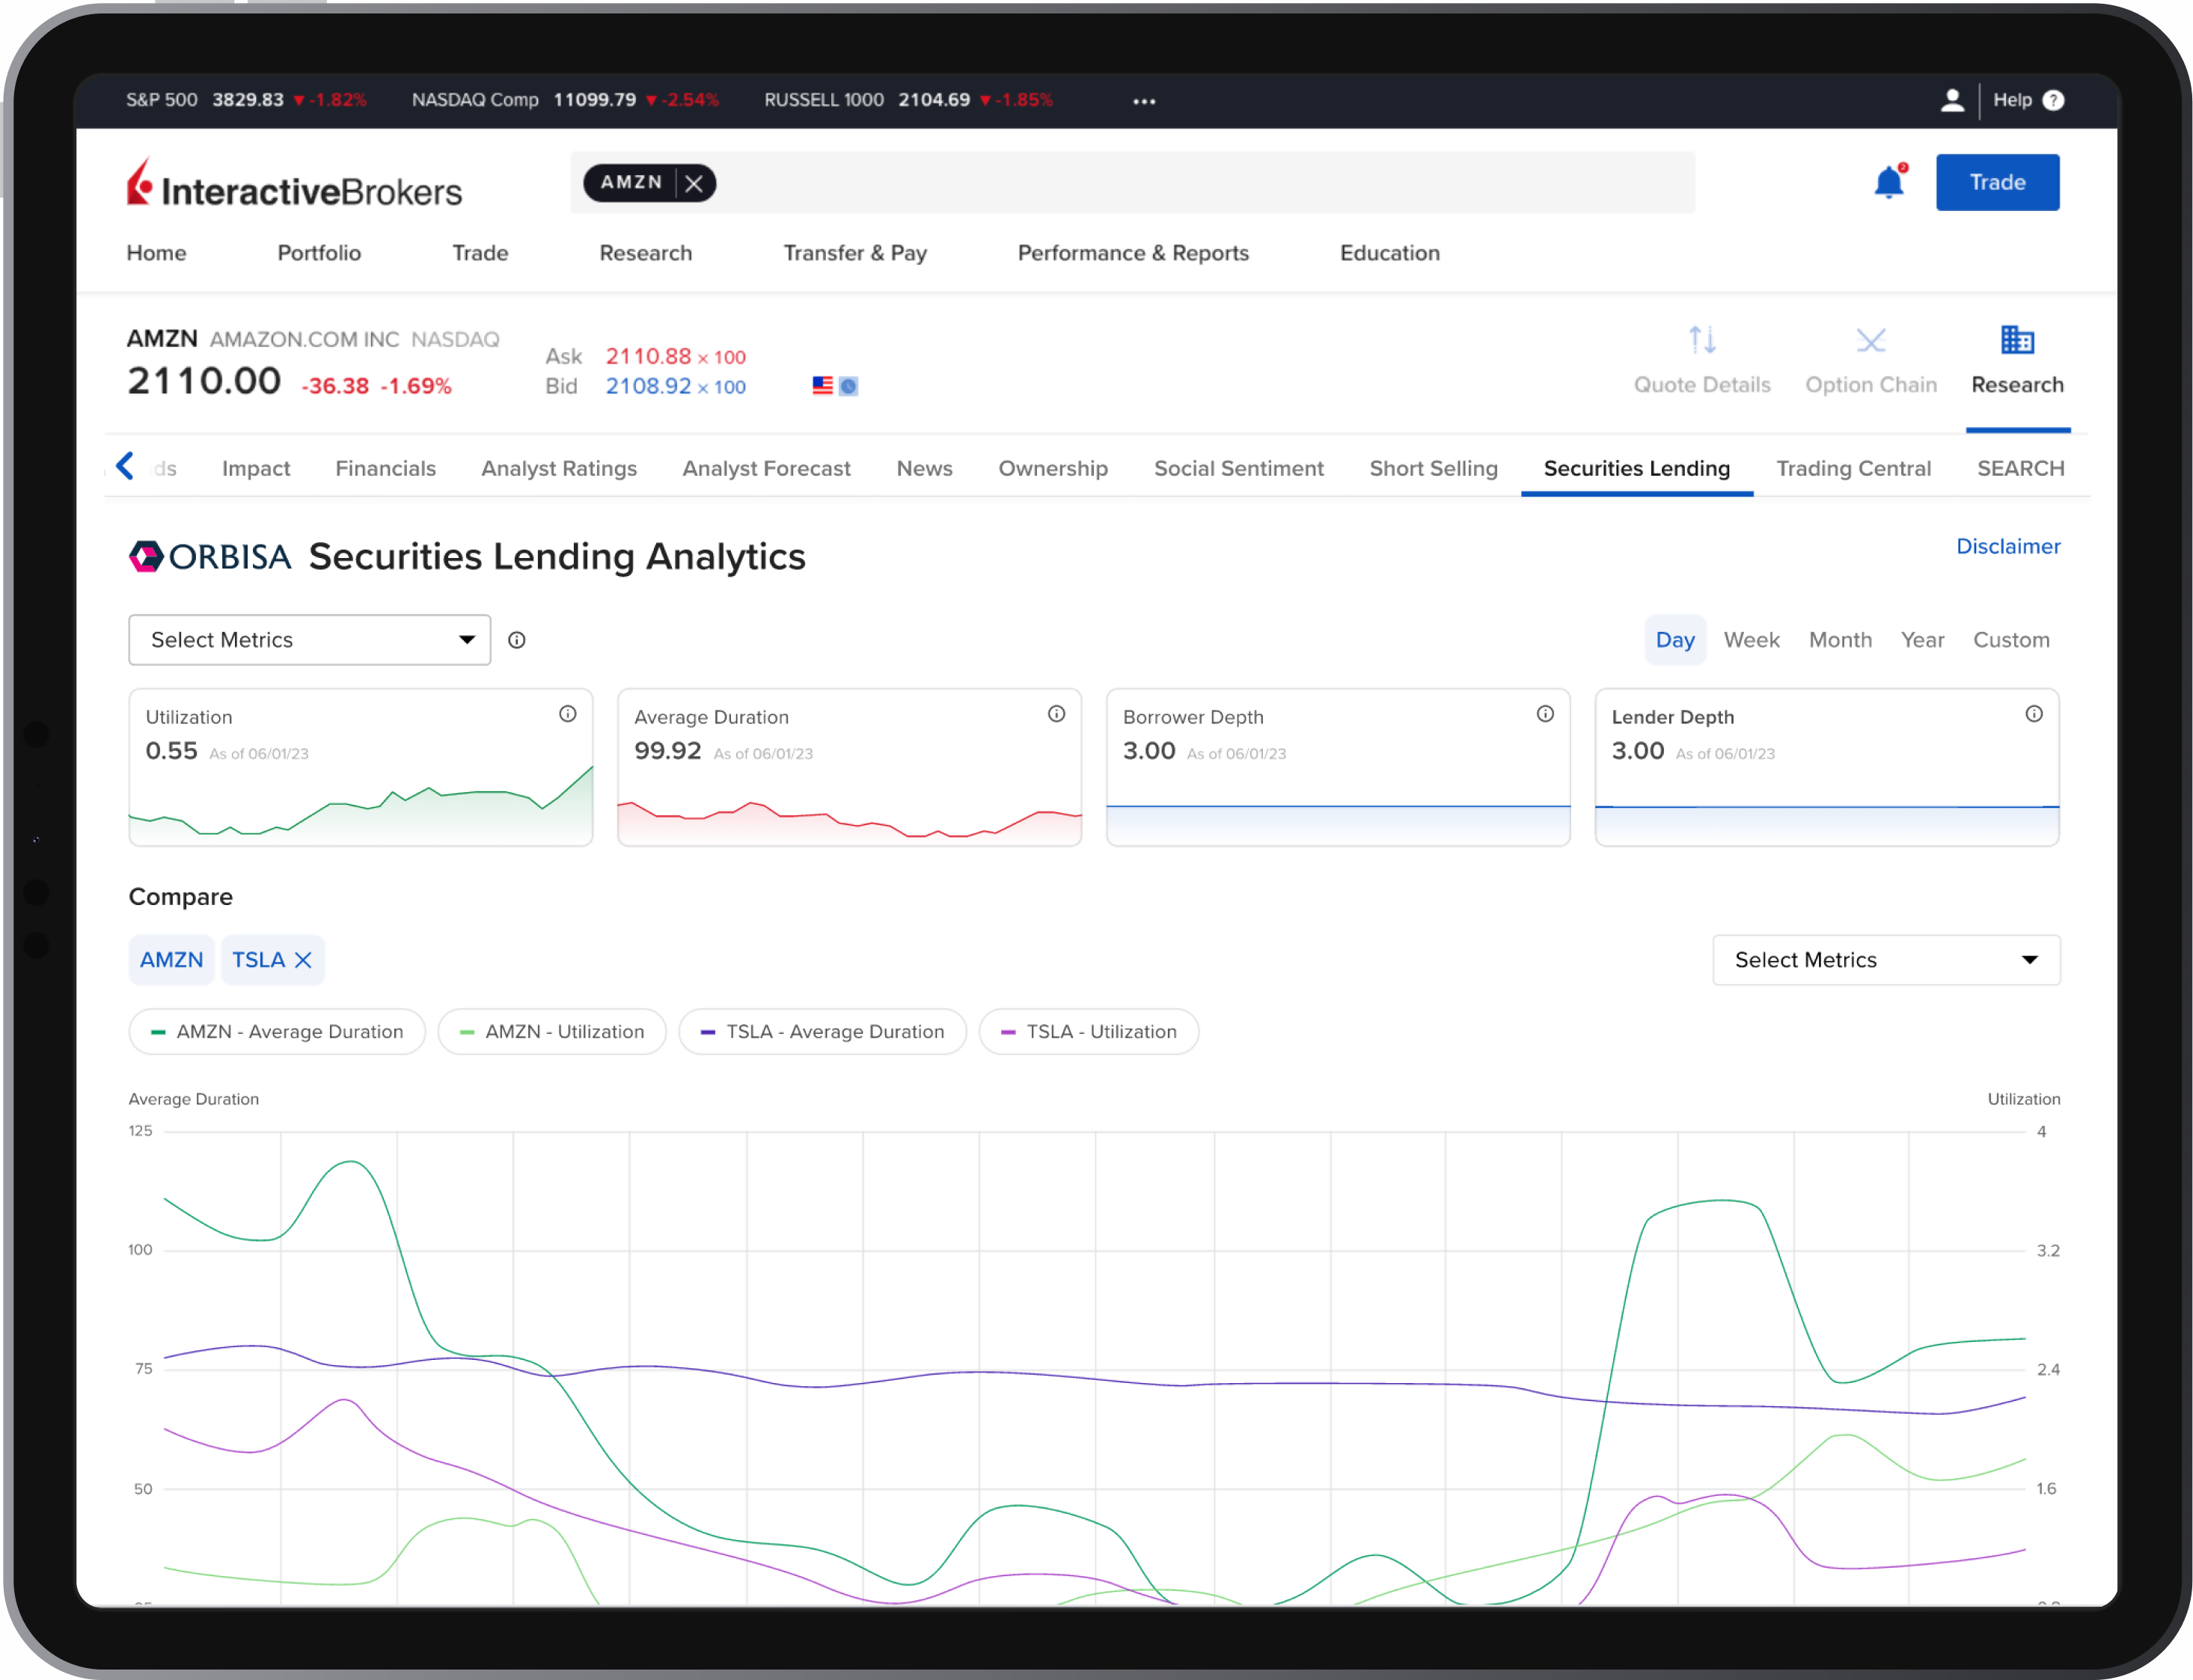
The Securities Lending Dashboard lets clients evaluate short trades by accessing key securities lending metrics. Investors can access real-time metrics such as Utilization, Shares On Loan and Short Interest Indicators to gauge borrowing demand in a name, which may reflect market sentiment. They can also leverage historical data to view recent trends and compare activity across two tickers.
Our Security Lending Dashboard is powered by complimentary and premium securities lending analytics from Orbisa, a leading market data provider. Gain transparency across your portfolio, develop strategic insight, validate sentiment and add depth to your trading analysis.
Complimentary Data
- Utilization: a measure of supply and demand in the securities lending market. This value measures the on-loan quantity (shares actively borrowed) relative to the inventory quantity (shares available to be borrowed), giving insight into how difficult it may be to locate a security
- Borrower Depth: a score indicating how many borrowers are actively borrowing shares. Fewer borrowers may indicate shares are more difficult to locate
- Lender Depth: a score indicating how many lenders are actively lending shares. The deeper the market, the easier it may be to locate a security
- Average Duration: the weighted average duration of all open loans, expressed in calendar days. Shorter duration may indicate recent borrowing and lending activity
Premium Data
- Short Interest Indicator: a measure of shares borrowed versus shares publicly available to trade. A high short interest could lead to a potential short squeeze if short sellers look to close out of positions
- On-Loan Quantity: the number of shares actively being borrowed
- On-Loan Value: the value of the shares actively being borrowed. This value will be influenced by the On-Loan Quantity as well as price movements of the security
- Days To Cover: an estimate of how long it would take to cover a short position given recent trading volumes by comparing the on-loan balance to recent trading volumes. The higher this figure, the greater the risk of a potential short squeeze
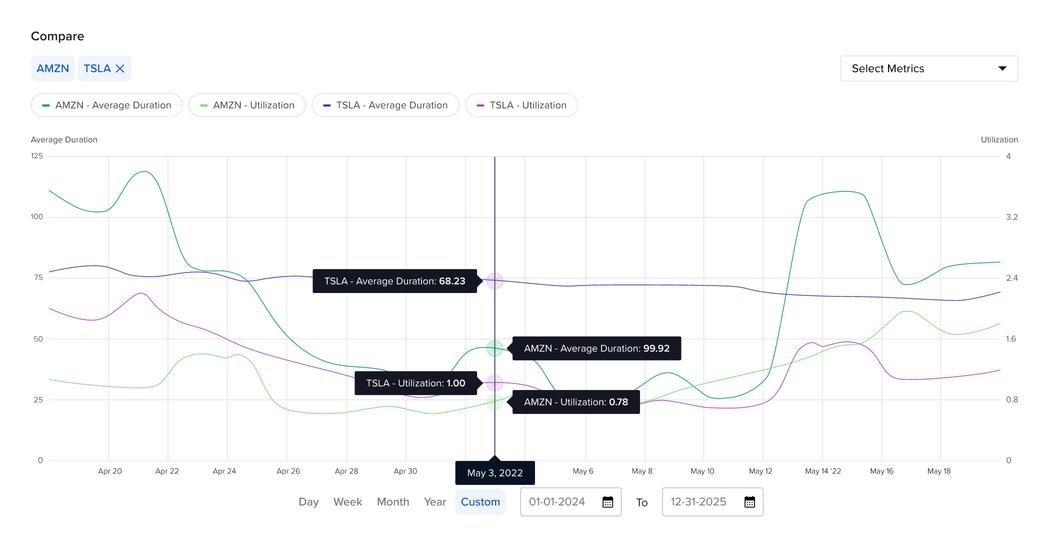
Users subscribed to Premium Orbisa Securities Lending Analytics also have access to 12 months of historical data to help understand when demand is increasing or decreasing. In addition, they can gain insight by comparing borrowing demand between two stocks.
Clients interested in placing a trade can take advantage of the Securities Loan Borrow system to search the availability of shortable securities by symbol and exchange, ISIN or CUSIP, and view the quantity available, number of lenders and indicative borrow rate.
The Securities Lending Dashboard is available in IBKR Mobile, Client Portal and Trader Workstation (TWS).

USER GUIDES
Get Started with the Securities Lending Dashboard
For more information on the Securities Lending Dashboard, select your trading platform.

